![]()
Q1 2017 Quarter End Report
Submitted by Kaizen Financial Advisors, LLC on April 21st, 2017Q1 2017 provided the highest returns for large cap stocks since 2013. In addition, other asset classes performed well. The only two laggards were bonds which were barely up for the quarter and commodities which lost 5% after a good 2016. One has to wonder, are we at the late stages of a bull market or will we keep limping along in a low growth environment?
Let’s take a closer look. For those of you visually oriented, here’s a summary graph, followed by the specific details.
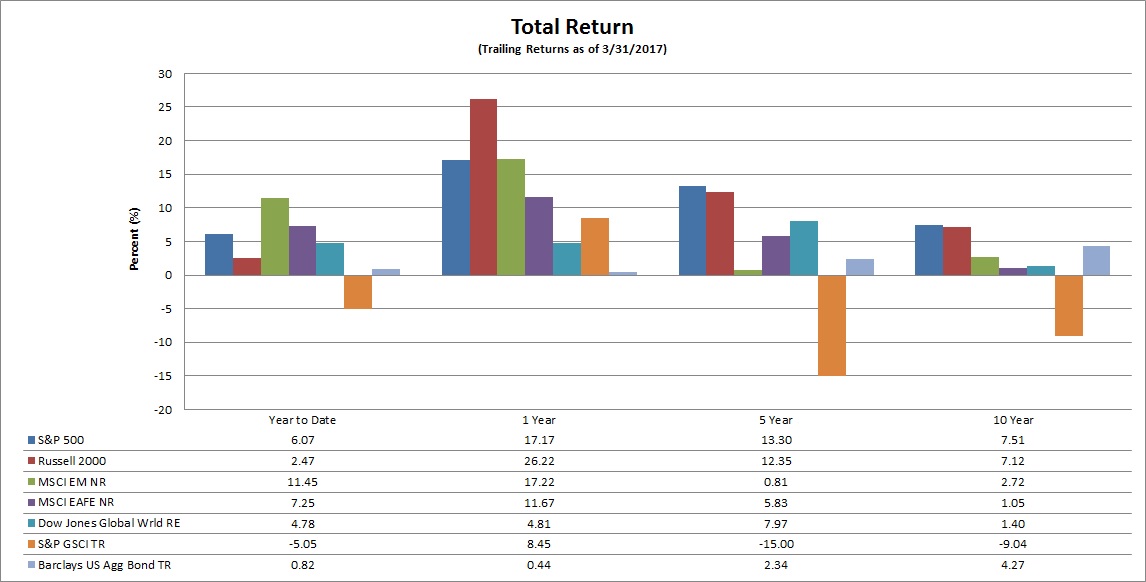
* Note that S&P 500, Russell 2000, Dow Jones Global World Real Estate, S&P GSCI, and Barclays US Aggregate Bond indices are reported in total return (TR), which includes all dividends reinvested, while MSCI EAFE and MSCI EAFE Emerging Markets are reported in price index (PR), which does not include dividends.
U.S. Index Performance
National markets, as measured by the S&P 500 and the Russell 2000 indices:
- The S&P 500 index posted a gain 6.07% for the quarter.
- The Russell 2000 Small-Cap index is up 2.47% for the quarter.
Global Returns
Meanwhile, in the global market:
- The broad-based MSCI EAFE index of companies in developed foreign economies gained 7.25% in dollar terms in this quarter.
- Emerging markets stocks of less developed countries, as represented by the MSCI EM index, gained 11.45% for the quarter.
Other Investments
Looking over the other investment categories:
- Dow Jones Global World Real Estate index rose 4.78% for the quarter.
- Commodities, as measured by the S&P GSCI index, lost 5.05% this quarter.
- The Barclays US Aggregate Bond index is up 0.82% for the year. Meanwhile, 30-year Treasuries are yielding 3.02%, up from 2.61% at this time last year, and 10-year Treasuries currently yield 2.40%, up from 1.78 % at this time last year.
THE QUARTER IN BRIEF
The opening quarter of 2017 was a historic one for Wall Street as the Dow Jones Industrial Average topped 20,000 for the first time. Equities rallied through January and February, then lost momentum in March; even so, the S&P 500 had gained 6.07% YTD when the quarter ended. The Federal Reserve raised the federal funds rate for only the third time in a decade, in response to strengthening inflation pressure and other signals of economic acceleration. Consumer confidence remained high. Commodities had a decidedly mixed quarter. New home sales improved, while existing home sales tapered off. The U.K. took another step toward its Brexit; the U.S. left the Trans-Pacific Partnership. Wall Street kept its hopes up for tax reform and lighter business and banking industry regulation.
DOMESTIC ECONOMIC HEALTH
As the stock market climbed, so did the Conference Board’s consumer confidence index. By March, it had reached an astonishingly high mark of 125.6. The University of Michigan’s household sentiment index declined from 98.5 to 96.9 across the quarter, but it remained well above its historical average of 86.0.
Factory and service sectors expanded nicely during Q1, according to the Institute for Supply Management. The Arizona-based organization’s manufacturing purchasing manager index was at 56.0 in January, 57.7 in February, and 57.2 in March. Its service sector PMI (the March number was not available at this writing) came in at 56.5 in January and 57.6 in February. All these numbers indicate solid growth.
One other sign of economic growth, of course, is inflation. In Q1, it became more palpable. By February, the Consumer Price Index had risen 2.7% in a year (the annualized advance on the core CPI was 2.2%). Producer prices were up as well. The headline PPI showed a 2.2% yearly advance in February, with core prices gaining 1.5% over 12 months.
Currently available data shows tepid consumer spending at the beginning of 2017. Personal spending was up just 0.2% in the opening month of the year and only 0.1% in February. Consumer incomes, however, rose 0.5% in January, then 0.4% in February. Households sent headline retail sales 0.6% higher in January, but only 0.1% a month later. There were gains in durable goods orders in both January (2.3%) and February (1.7%).
January’s Department of Labor jobs report showed the headline jobless rate at 4.8% and the U-6 rate measuring underemployment at 9.4%; a month later, those unemployment rates were respectively lower at 4.7% and 9.2%. Hiring was strong in both January and February, with 238,000 net new jobs added to payrolls in the first month and 235,000 net new jobs added in the second.
All this data encouraged the Federal Reserve to make its first interest rate move of the year. On March 15, it announced a widely expected, quarter-point hike, taking the federal funds rate to a target range of 0.75-1.00%. As Fed chair Janet Yellen told the media after the policy announcement, “The simple message is, the economy is doing well.” Investors who assumed the hike was coming scrutinized the Fed’s dot-plot forecast for any 2017 changes; they did not find any. Two incremental rate increases are still projected before the year ends.
GLOBAL ECONOMIC HEALTH
In late March, the United Kingdom formally triggered Article 50 of the Lisbon Treaty – the beginning of the Brexit, if you will. It now has until April 2019 to negotiate the terms of its departure from the European Union. Will it retain single market access after the Brexit, so that its citizens can keep working and living in other E.U. countries without visas? Or will it make a “hard” Brexit, a divorce dictated by court decisions and/or World Trade Organization rules that would cause its people to lose E.U. citizenship rights? In April, the negotiations begin. The euro area jobless rate stood at 9.5% as of February, a low unseen since May 2009. Eurostat estimated an inflation rate of 1.5% for the euro area for March, a 0.5% decline from February.
As the United States left the Trans-Pacific Partnership during the quarter, Asia-Pacific nations seeking a regional trade pact turned to Plan B – Plan B being the Regional Comprehensive Economic Partnership. This free trade agreement, now in negotiation, would bring China, Japan, and India into an economic accord with 13 other Asia-Pacific neighbors, including some of the region’s poorest nations, such as Myanmar and Laos. Asia-Pacific manufacturing purchasing manager indices improved as Q1 ended, with China’s official PMI advancing 0.2 points to 51.8 in March for its best reading since April 2012. Japanese and Indian factory activity also accelerated in March, with India’s PMI hitting a 5-month high.
WORLD MARKETS
As of March 31, the five best YTD performers among consequential global stock indices were Argentina’s MERVAL at +19.8%, Spain’s IBEX 35 at +11.9%, India’s Sensex at +11.2%, the MSCI Emerging Markets at +11.5%, and Singapore’s Straits Times at +10.2%. There were other big quarterly gains: 7.9% for Brazil’s Bovespa, 7.2% for Germany’s DAX, 6.5% for Italy’s FTSE MIB, 6.4% for the Euro Stoxx 50, 6.3% for the Global Dow, 9.6% for Hong Kong’s Hang Seng, and 6.6% for South Korea’s Kospi.15,16
In fact, it is hard to find a marquee stock index that retreated in Q1. Scrutiny reveals two: Russia’s RTS slipped 3.3%, and Japan’s Nikkei 225 lost 1.1%. To round things out, China’s Shanghai Composite gained 3.8% in Q1; the United Kingdom’s FTSE 100, 2.5%; and the MSCI World, 5.9%.15,16adding thousands of new pages to it. We know that there is general opposition to any form of estate taxes, but nobody is proposing which deductions would be eliminated in order to make this package revenue-neutral.
REAL ESTATE
Q: Did mortgage rates ascend or descend in the first quarter? A: They descended. On December 29, the average interest rate on a conventional home loan was 4.32%, according to Freddie Mac’s Primary Mortgage Market Survey. By the March 30 PMMS, it was just 4.14%. Similar declines were seen for the average rate on the refinancer’s favorite, the 15-year FRM (3.55% to 3.39%), and the average rate on the 5/1-year ARM (3.30% to 3.18%).
Census Bureau data showed new home sales rising 5.3% in January and another 6.1% in February. Resales wavered, increasing 3.3% for January and decreasing 3.7% the next month, according to the National Association of Realtors.
Regarding the sales numbers that matter most (the annualized ones), existing home sales were up 5.4% in the year ending in February; new home sales, 12.8%. In the second month of 2017, the median price for an existing home was up 7.7% from a year ago at $228,400. The median new home price was up at $329,900 as of December, but it had fallen to $296,200 by February.
What did other key real estate indicators do in the quarter? Housing starts and building permits went in opposite directions. Starts fell 1.9% in January, then rose 3.0% a month later; permits advanced 4.6% for January, but retreated 6.2% in February. NAR’s pending home sales index rose 5.5% to 112.3 in February after slipping 2.8% in January. Finally, January’s 20-city S&P/Case-Shiller home price index arrived in late March, revealing a 0.2% monthly improvement and a 5.7% annualized advance. Similarly, there have been no details about the infrastructure package, which means we don’t know yet whether it would be a budget-busting package of pork barrel projects or a real contribution to America’s global competitiveness.
With this quarter now history, investors wonder what to expect out of Q2. A bullish outlook still predominates on Wall Street; though, questions linger and as the bull market ages are we are moving ever closer to a period when stock prices will go down? If we do experience a downturn, then you should look at the next bear market the way the most successful investors do, and envision a terrific buying opportunity, a time when stocks go on sale for the first time in the better part of a decade. For some reason, people go to the shopping mall to buy when items go on sale, and do the opposite when the investment markets go down. Knowing this can be an unfair advantage to your future wealth, and even make you look forward to the end of this long, unusually steady, increasingly frantic bull run in stocks. After all, if history is any indication, the next downturn will be followed by another bull run.
Sources:
Wilshire index data: http://www.wilshire.com/Indexes/calculator/
Russell index data: http://www.russell.com/indexes/data/daily_total_returns_us.asp
S&P index data: http://www.standardandpoors.com/indices/sp-500/en/us/?indexId=spusa-500-...
Nasdaq index data:
http://quotes.morningstar.com/indexquote/quote.html?t=COMP
http://www.nasdaq.com/markets/indices/nasdaq-total-returns.aspx
International indices: https://www.msci.com/end-of-day-data-search
Commodities index data: http://us.spindices.com/index-family/commodities/sp-gsci
Treasury market rates: http://www.bloomberg.com/markets/rates-bonds/government-bonds/us/
Bond rates:
http://www.bloomberg.com/markets/rates-bonds/corporate-bonds/
General:
http://www.marketwatch.com/story/debate-about-path-for-stock-market-rage...
http://www.marketwatch.com/story/how-investors-can-learn-to-stop-worryin...
http://www.reuters.com/article/us-usa-economy-gdp-idUSKBN1711MX?feedType...